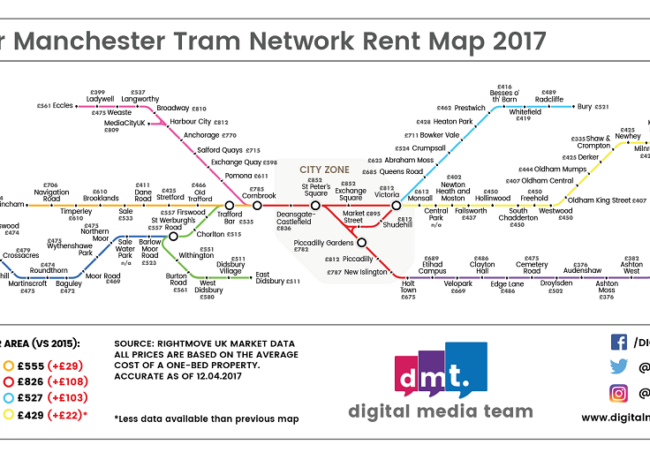
Metrolink rent map highlights city price discrepancies
One Metrolink stop can make a £200 monthly difference in your rent, according to research based around the Greater Manchester tram network.
The Manchester Metrolink rent map shows an average rent of £612 in Monsall, compared to £812 one stop towards the city centre at Victoria.
The Digital Media Team, based in Altrincham, first published the map in 2015 and has updated it to show how rent prices have changed across the area. It shows the average rent of a one-bedroom property each month.
The map tracks how far rents have risen throughout Greater Manchester, most noticeably in the city centre and Salford. Prices have gone up by an average of £108 since 2015 in the city centre, with the biggest increase in the area surrounding Victoria, from £677 to £812. Market Street has the highest average rent across the entire region, at £895.
Rental prices in Langworthy, Salford, have risen by nearly £100, from £442 in 2015 to £537. Altrincham has also seen a rental hike of £108, from £596 to £704.
However, not all prices have increased. Prices along the line to Tameside decreased by an average of £47, although as the map points out, this difference may be due to a lack of data. A slight decrease was also seen on the line to Manchester Airport.
The Rochdale Metrolink is the cheapest line to rent on, with an average rent of £429. However, the areas with the cheapest rent are along the Ashton-under-Lyne Metrolink; Audenshaw and Ashton Moss both have an average rent of £376.


